Lean Six Sigma Green Belt Training
 1K+ Reviews
Instructor-Led Training Parameters
Course Highlights
- Instructor-led Online Training
- Project Based Learning
- Certified & Experienced Trainers
- Course Completion Certificate
- Lifetime e-Learning Access
- 24x7 After Training Support
Lean Six Sigma Green Belt Training Course Overview
Lean Six Sigma Green Belt training builds the proficiency in the trainees to improve the capability of a process instead of controlling product quality. The courses focus on all the aspects of the DMAIC and develop strong problem-solving skills. By exploring the Six Sigma tools, the participants will take deep into the process improvement conducted at small-scale. They can successfully deploy Six Sigma projects by laying emphasis on cost reduction and process cycle time reduction while improving the customer satisfaction.
By the end of the Lean Six Sigma Green Belt training course, you can exhibit the following skills:
- Understand the concept of Six Sigma
- Describe the DMAIC approach for process improvement
- Explain the tools and techniques used in different phases of DMAIC i.e. Define, Measure, Analyse, Improve and Control phases
- Determine how to analyse process data and solve problems by controlling the processes
- Lead small-scale Six Sigma projects or assist Black Belts on large-scale projects to deliver tangible results
- IT Professionals
- Business Professionals
- Operations Managers
- Senior team leaders
- Quality and process improvement professionals
- Aspirants interested in process improvement
- Individuals interested in becoming Six Sigma professionals
Two years of working experience in the filed of quality/process management
OR
Lean Six Sigma Yellow Belt Certified
On writing the examination, get certified from any of the organization Multisoft Systems or IASSC (International Association for Six Sigma Certification) as per your preference.
Instructor-led Training Live Online Classes
Suitable batches for you
| Jul, 2026 | Weekdays | Mon-Fri | Enquire Now |
| Weekend | Sat-Sun | Enquire Now | |
| Aug, 2026 | Weekdays | Mon-Fri | Enquire Now |
| Weekend | Sat-Sun | Enquire Now |
Lean Six Sigma Green Belt Training Course Content
1.0 Introduction: Overview of Six Sigma
- 1.1 Value of Six Sigma
- Recognize why organizations use six, Origins of six sigma
- 1.2 Organizational drivers and metrics
- Recognize key drivers for business (profit, market share, customer satisfaction, efficiency, product differentiation) and how key metrics and scorecards are developed and impact the entire organization.
2.0 Six Sigma—Define
- 2.1 Process elements
- Define and describe SIPOC
- 2.2 Owners and stakeholders
- Identify process owners, internal and external customers, and other stakeholders in a project.
- 2.3 Identify Customers & Customer Segmentation
- Identify and classify internal and external customers as applicable to a particular project, and show how projects impact customers.
- 2.4 Collect & Classify Customer data
- VOC, Survey Methods, Kano Analysis.
- 2.5 Translate Customer requirements
- Translate customer feedback into project goals and objectives, including critical to quality (CTQ) attributes and requirements statements. Use of Quality Function Deployment (QFD) to translate customer requirements into performance measures
- 2.6 Project Identification & Planning tools
- Define, select, and use 1) Affinity Diagrams, 2) Interrelationship Digraphs, 3) Tree Diagrams, 4) Prioritization Matrices, 5)Matrix Diagrams, 6) Process Decision Program (PDPC) Charts, and 7) Activity Network Diagrams – Gnatt Charts, PERT & CPM.
- 2.7 Organizational goals and six sigma projects
- Describe the project selection process, including knowing when to use six sigma DMAIC methodology.
- 2.8 Project Charter & Project Metrics
- Define and describe elements of a Project Charter. Development of metrics – COQ, DPU, DPMO, RTY
- 2.9 Team stages and DMAIC
- Define and describe the stages of team evolution, including forming, storming, norming, performing, adjourning, and connectivity with DMAIC.
- 2.10 Six sigma - team roles and responsibilities
- Describe and define the roles and responsibilities of participants on six sigma teams, including black belt, master black belt, green belt, champion, executive, coach, facilitator, team member, sponsor, process owner, etc.
3.0 Six Sigma—Measure
- 3.1 Process Mapping
- Develop and review process maps, flowcharts, etc.
- 3.2 Process inputs and outputs
- Identify process input variables and process output variables (SIPOC), classify as CTQs & CTPs including Control & Noise CTPs.
- 3.3 Probability and statistics
- Distinguish between enumerative (descriptive) and analytical (inferential) studies, and distinguish between a population parameter and a sample statistic.
- 3.4 Basic probability concepts
- Describe and apply concepts such as independence, mutually exclusive, multiplication rules, etc.
- 3.5 Types of data and measurement scales
- Identify and classify continuous (variables) and discrete (attributes) data. Describe and define nominal, ordinal, interval, and ratio measurement scales.
- 3.6 Data collection methods
- Define and apply methods for collecting data such as check sheets, Stratification, coded data, etc.
- 3.7 Techniques for assuring data accuracy and integrity
- Define and apply techniques such as random sampling, stratified sampling, sample homogeneity, etc.
- 3.8 Descriptive statistics
- Define, compute, and interpret measures of dispersion and central tendency, and construct and interpret frequency distributions and cumulative frequency distributions.
- 3.9 Graphical methods
- Depict relationships by constructing, applying and interpreting diagrams and charts such as stem-and-leaf plots, box-and-whisker plots, run charts, scatter diagrams, Pareto charts, etc. Depict distributions by constructing diagrams such as histograms, normal probability plots, etc.
- 3.10 Probability distributions
- Describe and interpret binomial, and Poisson, normal, chi square, Student’s t, and F distributions
- .
- 3.11 Central limit theorem and sampling distribution of the mean
- Define the central limit theorem and describe its significance in the application of inferential statistics for confidence intervals, control charts, etc.
- 3.12 Measurement system analysis
- Calculate, analyze, and interpret measurement system capability using repeatability and reproducibility (GR&R), measurement correlation, bias, linearity, percent agreement, and precision/tolerance (P/T)
4.0 Sigma—Analyze
- 4.1 Cause Analysis
- Root Cause Analysis, Cause & Effects Analysis.
- 4.2 Failure Mode and Effects Analysis (FMEA)
- Define and describe failure mode and effects analysis (FMEA). Describe the purpose and use of the risk priority number (RPN).
- 4.3 Run Charts
- Plotting Sequential data & analyze for Normality, Trends, Patterns.
- 4.4 Multi-Vari studies
- Create and interpret multi-vari studies to interpret the difference between positional, cyclical, and temporal variation; apply sampling plans to investigate the largest sources of variation. (Create)
- 4.5 Simple linear correlation and regression
- Interpret the coefficients of co-relation & determination – r & R2 and determine; recognize the difference between correlation and causation. Interpret the linear regression equation and determine its statistical significance. Use regression models
5.0 Six Sigma—Improve and Control
- 5.1 Process capability and performance
- Identify, describe, and apply the elements of designing and conducting process capability studies, including identifying characteristics, identifying specifications and tolerances, developing sampling plans, and verifying stability and normality.
- 5.2 Process performance vs. specification
- Distinguish between natural process limits and specification limits, and calculate process performance metrics such as percent defective. (Evaluate)
- 5.3 Process capability indices
- Define, and calculate Cp and Cpk, and assess process capability.
- 5.4 Process performance indices
- Define, and calculate Pp, Ppk, and assess process performance.
- 5.5 Short-term vs. long-term capability
- Describe the assumptions and conventions that are appropriate when only short-term data are collected and when only attributes data are available. Describe the changes in relationships that occur when long-term data are used, and interpret the relationship between long- and short-term capabilities as it relates to a 1.5 sigma shift.
- 5.6 Process capability for attributes data
- Compute the sigma level for a process and describe its relationship to Ppk.
- 5.7 Statistical Process Control (SPC)
- Define and describe how rational sub-grouping is used. Describe the objectives and benefits of SPC, including controlling process performance, identifying special and common causes, etc.
- 5.8 Selection and application of Control Charts
- Identify, select, construct, and apply the following types of control charts: X-bar −R, Xbar− s, individuals and moving range (I-mR / X-mR), Pre-Control chart, median & moving range, p, np, c, and u.
- 5.9 Analysis of control charts
- Interpret control charts and distinguish between common and special causes using rules for determining statistical control.
- 5.10 Control plans, SOPs, Work Instructions.
- Developing these documents and holds the gains, and assist in implementing controls and monitoring systems.

Request for Enquiry
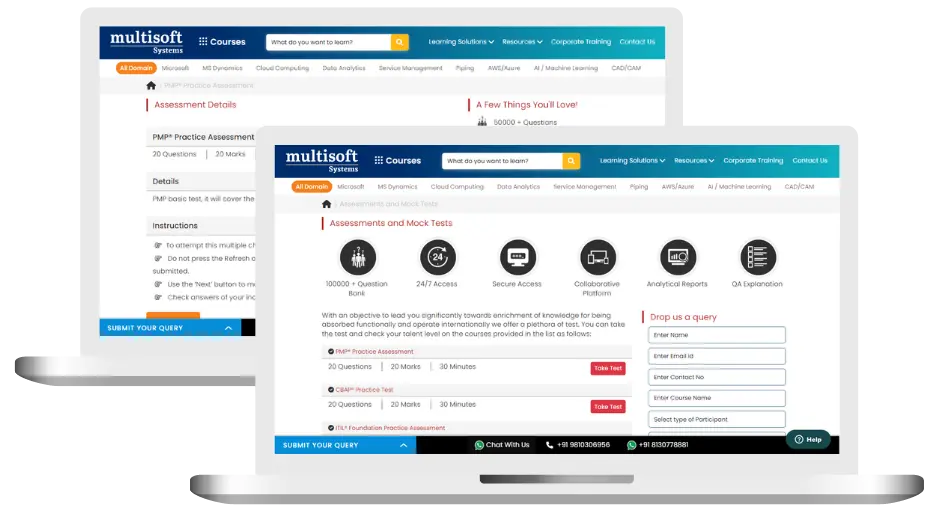
Lean Six Sigma Green Belt Training (MCQ) Assessment
This assessment tests understanding of course content through MCQ and short answers, analytical thinking, problem-solving abilities, and effective communication of ideas. Some Multisoft Assessment Features :
- User-friendly interface for easy navigation
- Secure login and authentication measures to protect data
- Automated scoring and grading to save time
- Time limits and countdown timers to manage duration.
Lean Six Sigma Green Belt Corporate Training
Employee training and development programs are essential to the success of businesses worldwide. With our best-in-class corporate trainings you can enhance employee productivity and increase efficiency of your organization. Created by global subject matter experts, we offer highest quality content that are tailored to match your company’s learning goals and budget.
Global Clients


Customized Training
Be it schedule, duration or course material, you can entirely customize the trainings depending on the learning requirements
Expert
Mentors
Be it schedule, duration or course material, you can entirely customize the trainings depending on the learning requirements
360º Learning Solution
Be it schedule, duration or course material, you can entirely customize the trainings depending on the learning requirements
Learning Assessment
Be it schedule, duration or course material, you can entirely customize the trainings depending on the learning requirements
Certification Training Achievements: Recognizing Professional Expertise
Multisoft Systems is the “one-top learning platform” for everyone. Get trained with certified industry experts and receive a globally-recognized training certificate. Some Multisoft Training Certificate Features :
- Globally recognized certificate
- Course ID & Course Name
- Certificate with Date of Issuance
- Name and Digital Signature of the Awardee
Lean Six Sigma Green Belt Training Trainer Profile
19+ Years Experienced
Our Lean Six Sigma Green Belt Corporate & Certification Program trainers bring 13+ years of proven industry expertise, delivering practical insights aligned with real project environments.
Trained 3950+ Professionals
Our expert trainers have successfully trained 3350+ professionals through structured, real-time training programs designed for industry readiness and career growth.
Certified Experts & Real-Time Project Learning
Build strong practical skills through live project-based training sessions led by certified industry experts with real-world experience.
Hands-on Learning Approach
Gain practical exposure through real-time scenarios, industry case studies, and hands-on assignments that simulate actual project challenges.
Certification Training Guidance
Receive expert support to prepare effectively, practice strategically, and confidently achieve globally recognized certification success.
Customized Training Delivery
Flexible training approach tailored to individual learning goals, skill levels, and evolving industry requirements for maximum effectiveness.
What Attendees are Saying
Our clients love working with us! They appreciate our expertise, excellent communication, and exceptional results. Trustworthy partners for business success.
Share Feedback Download Curriculum