Spotfire Certification Training
 1K+ Reviews
Instructor-Led Training Parameters
Course Highlights
- Instructor-led Online Training
- Project Based Learning
- Certified & Experienced Trainers
- Course Completion Certificate
- Customized Learning Schedule
- Doubt-Clearing Sessions
Spotfire Certification Training Course Overview
Spotfire is a Business Intelligence platform and a software for the analytics that allows examining the data by using the analytical and statistical components. By joining the Spotfire Certification Training on Multisoft Systems, you can get the thorough knowledge of the topics such as Analytic Operations & Services, Representing Data Statically, Relations in the Data Table, Properties of a Column, Percentage Formatting and much more.
After completing the Spotfire Training, you will be able to understand the following topics:
- Analytic operations and service
- Working of Server
- Row and Column loading
- Visualization in Table
- Access format
- Percentage Formatting
- Property control on visualization
- Use of inbuilt functions of Action control
- Information Links and Joins
Join the Spotfire training program to learn all the essential ways of getting a holistic view of your business.
- Business Intelligence Enthusiasts
- ETL Developers
- SQL Developers,
- Database Architects
- Project Managers and Business Object Specialists
Instructor-led Training Live Online Classes
Suitable batches for you
| Aug, 2026 | Weekdays | Mon-Fri | Enquire Now |
| Weekend | Sat-Sun | Enquire Now | |
| Sep, 2026 | Weekdays | Mon-Fri | Enquire Now |
| Weekend | Sat-Sun | Enquire Now |
Spotfire Certification Training Course Content
Getting started with Spotfire Components and various related Operations
- Overview of Spotfire
- Analytic operations and services
- Business Components
- Explaining Spotfire with a definition
- Statistical capability
- Statistical features
- What is Hit map?
- Define Mortality rate
- Representing data statically
- Tools for analysis
- Various Spotfire Components
- Understanding the concept and working of Web player
- Working of Server
- Data Insertion
- Importing data from excel
- Define Name row, Data row and Type row
- Techniques of Visualization
- Introduction to Dashboard
- Working with Bar charts
- Define Filters in Spotfire
2. Creating DataTable, Introduction to Data sources, Data access, Text Areas and Sharing and collaboration
- Creating Data Table
- Creating Data Table using files and Database
- Data Table Behavioral Properties
- Relations in data Table
- Column Matching and Relations in Column
- Extracting Single Data Date from multiple data sources
- Row and Column loading
- Filters and Settings in Data Table
- Filter Schemas
- Calculated Column Creation
- Binned Column Creation
- Hierarchy Column Creation
3. Operations in Data Visualization
- Understanding Visualization
- Properties of a Column
- Column Selector
- Trellis
- ‘Color by’ property
- Markers
- Concept of Zoom Slider
- Visualization in Table
- Cross-table visualization
- Working with Bar chart, Combination chart and Line chart
4. Advanced operations in Visualization, Multivariate Analysis
- Sharing a visualization file
- Data Importing
- Creating a Tag
- Creating a list
- Error Bars
- Access format
- Data Labels
- Concept of Color coding
- Subsets
- Summary Table
- Pie chart
- Tree Map
- Scatter plot
5. Spotfire Server Overview, Advanced Chats
- Understanding the Configuration
- Using Spotfire Expression
- Percentage Formatting
- Labels
- Expressions
- Waterfall Chart
- Schema
- MySQL
- Heat map
- Dendograms
- Line chart
- Map chart
6. Visualization Property Control, Data Analysis including Data Organization, Various Analysis techniques
- Analytics Framework
- Scope of Spotfire professional
- Visualization
- Input filter
- Order by priority
- Property control on visualization
- Color coding
- Profit v/s Sale
- Demonstration of property control
- Creation of Action control
- Use of inbuilt functions of Action control
- Dynamic Items
- Dashboards
- Filter Schemas
- Creation of filter
- Box plot
- Pareto chart
- Combination chart
7. Administration in Spotfire
- Installation components and Consoles
- Working with information Designs
- Information Links and Joins
- Leaning about Personalized Information links
- Web Player DXP Deployment
- Library Administration
- Authorization and Authentication
8. Project – IRON Python
- Introduction to Iron Python
- Advanced tools and operations in Iron Python
- Creation of Data Forms
- Creation of Collaboration platforms
- Workflow Frameworks and their creation
- Finding End-to-end solutions
- Services of Automation

Request for Enquiry
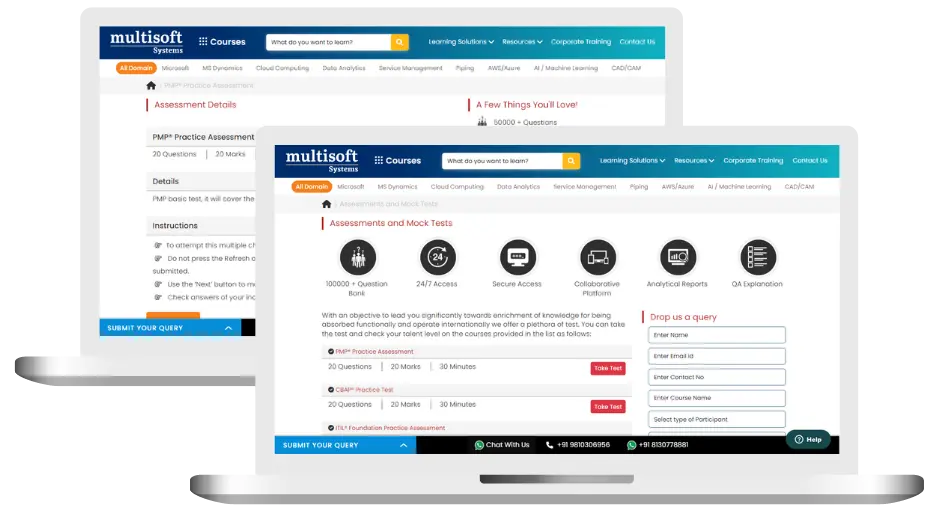
Spotfire Training (MCQ) Assessment
This assessment tests understanding of course content through MCQ and short answers, analytical thinking, problem-solving abilities, and effective communication of ideas. Some Multisoft Assessment Features :
- User-friendly interface for easy navigation
- Secure login and authentication measures to protect data
- Automated scoring and grading to save time
- Time limits and countdown timers to manage duration.
Spotfire Corporate Training
Employee training and development programs are essential to the success of businesses worldwide. With our best-in-class corporate trainings you can enhance employee productivity and increase efficiency of your organization. Created by global subject matter experts, we offer highest quality content that are tailored to match your company’s learning goals and budget.
Global Clients


Customized Training
Be it schedule, duration or course material, you can entirely customize the trainings depending on the learning requirements
Expert
Mentors
Be it schedule, duration or course material, you can entirely customize the trainings depending on the learning requirements
360º Learning Solution
Be it schedule, duration or course material, you can entirely customize the trainings depending on the learning requirements
Learning Assessment
Be it schedule, duration or course material, you can entirely customize the trainings depending on the learning requirements
Certification Training Achievements: Recognizing Professional Expertise
Multisoft Systems is the “one-top learning platform” for everyone. Get trained with certified industry experts and receive a globally-recognized training certificate. Some Multisoft Training Certificate Features :
- Globally recognized certificate
- Course ID & Course Name
- Certificate with Date of Issuance
- Name and Digital Signature of the Awardee
Spotfire Certification Training Trainer Profile
19+ Years Experienced
Our Spotfire Corporate & Certification Program trainers bring 13+ years of proven industry expertise, delivering practical insights aligned with real project environments.
Trained 3950+ Professionals
Our expert trainers have successfully trained 3350+ professionals through structured, real-time training programs designed for industry readiness and career growth.
Certified Experts & Real-Time Project Learning
Build strong practical skills through live project-based training sessions led by certified industry experts with real-world experience.
Hands-on Learning Approach
Gain practical exposure through real-time scenarios, industry case studies, and hands-on assignments that simulate actual project challenges.
Certification Training Guidance
Receive expert support to prepare effectively, practice strategically, and confidently achieve globally recognized certification success.
Customized Training Delivery
Flexible training approach tailored to individual learning goals, skill levels, and evolving industry requirements for maximum effectiveness.
What Attendees are Saying
Our clients love working with us! They appreciate our expertise, excellent communication, and exceptional results. Trustworthy partners for business success.
Share Feedback Download Curriculum